Data Products
Argo Profiling Floats
University of Hawaii Argo Profiling Floats Data Page
CPIES Data from GSO/URI
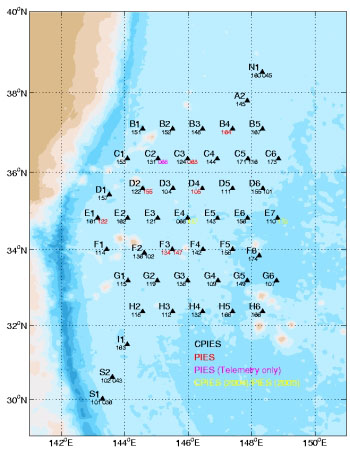
Shown below is the KESS CPIES/PIES array superimposed on Smith and Sandwell bathymetry contoured every 1000 m. The CPIES/PIES were moored in water depths ranging from 5300 m on the western side of the array to 6300 m in the east. Data is available for 46 sites. Site designator is given in the upper left hand corner and IES serial number is listed under the triangles. Black is for CPIES sites, red for PIES sites, magenta specifies sites where only telemetry was taken, and yellow designates where instruments were CPIES in 2005, but PIES in 2006. The measurements were made during April 2004 to July 2006 under the sponsorship of the National Science Foundation. The measured quantities include pressure, vertical acoustic round-trip travel time, and currents. All data files in the CPIES archive are provided in ASCII format.
 CONTENTS of HOURLY FILES
There are up to three files for each instrument, where XX is the site designator and YYY is the IES serial number:
- prs/XX_SNYYY.dat — pressure in decibars
- tau/XX_SNYYY.dat — vertical acoustic travel time in seconds
- currents/XX_SNYYY.dat — u,v velocities in cm/sec
These are the highest quality versions of the data after the least amount of processing. Large data spikes (outliers) and long term drifts have been removed from these records. Details of the processing are provided in the data report. Each file contains year, month, day, hour, minute, second and either pressure, travel time or currents. Missing data values are indicated by NaN.
CONTENTS of 72 HR LOWPASSED FILES
There are up to three files for each instrument, where XX is the site designator:
- prs/XX.dat — leveled, demeaned pressure in decibars
- tau/XX.dat — vertical acoustic travel time from 0 to 1400 dbar in seconds
- currents/XX.dat — u,v velocities in cm/sec
The above pressure, travel time and current records were lowpass filtered using a 4th order Butterworth filter with a 72 hr cutoff period. Further details are provided in the data report. These pressures have been leveled to a common geopotentail using mean currents. The travel times have been referenced to a common pressure level. These values are equivalent to the integral of sound speed between the surface and 1400 dbar times two (ie., round-trip). Each file contains year, month, day, hour, minute, second, and either pressure, travel time or currents.
CTD Data from GSO/URI
The CTD directory contains files from the deployment (2004), telemetry (2005) and recovery (2006) cruises. Each file contains pressure, temperature and salinity. Data are provided in either ASCII, netCDF, or csv format.
KESS Mooring Data
- Documentation
- Moored Profilers
- Current Meters
- ADCP
- Heat Content and STMW thickness
KEO Buoy
- Kuroshio Extension Observatory (KEO) – Data Website: KEO data in OceanSITES format which contain the entire KEO record. The daily files are updated every day to include the previous day’s realtime data, as well as any delayed-mode data. The hi_res files are updated as delayed-mode data become available after recovery.
- KEO Data: Files with a ‘.nc’ extension are OceanSITES NetCDF files, and files with the ‘.head’ extension contain just the header of these files in ascii format for easy browsing. Note that the qualifiers dy, hr, 10m, and 2m mean daily, hourly, 10 minute and 2 minute, respectively.
Other KESS related data
- CLIMODE is a project to study the dynamics of ‘Eighteen Degree Water’ (EDW), the subtropical mode water of the North Atlantic. EDW is but one example of a pervasive tendency for mode waters to form adjacent to strong baroclinic fronts in all the world’s oceans. EDW is a canonical example of a subtropical mode water, all of which are found in regions of significant air-sea exchange.
- SYNOP East current meter data: These are the low passed 1 day time series from SYNOP East near 55W in the Gulf Stream in a similar format to the KESS current meter data.
- SYNOP Central current meter data: These are the low passed 1 day time series from SYNOP Central near 68W in the Gulf Stream in a similar format to the KESS current meter data.
- Westpac current meter data: These are the low passed 1 day time series from Westpac near 152E in the Kuroshio Extension in a similar format to the KESS current meter data.
- KERE current meter data: These are the low passed 1 day time series from KERE near 142E in the Kuroshio Extension in a similar format to the KESS current meter data.
- Mean Dynamic Topography
- KESS Atmospheric Sounding Data: This includes sounding data beginning 2004 on the observational lines which crossed SST front of Kuroshio Extension. The purpose of these deployments were to observe the influence of SST on temperature and humidity in the lower atmospheric vertical structure.