CPIES Overview
Overview | Results
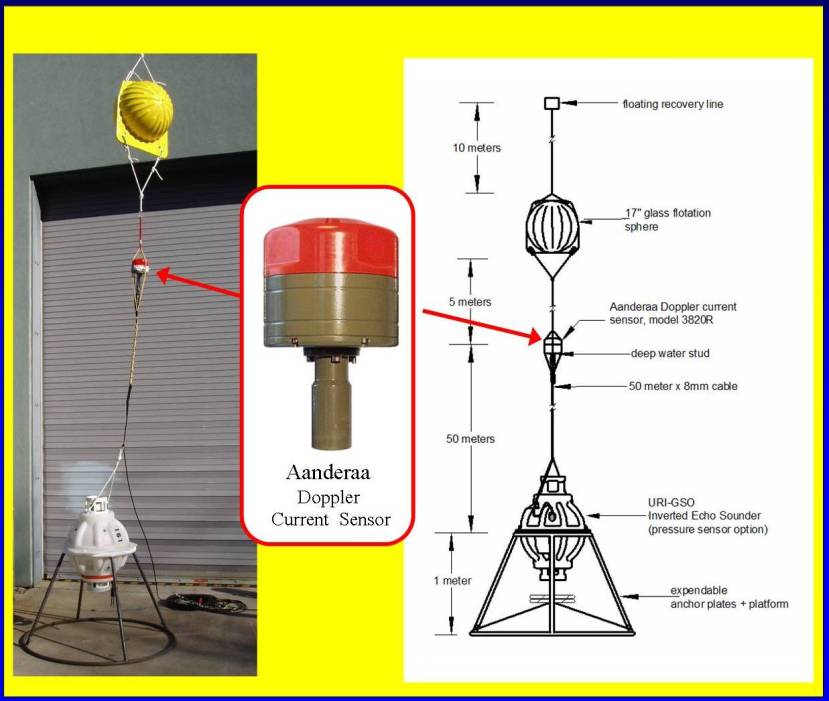
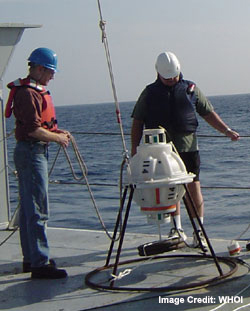 The inverted echo sounder (IES) measures acoustic echo time (τ) from the sea bed to the sea surface. The “PIES” is an IES with a bottom-pressure sensor. The “CPIES” is an IES with added sensors to measure both current (tethered 50 m above the sea floor to avoid the bottom boundary layer) and bottom pressure. The instruments sample hourly and have telemetry systems that enable us to download data to a computer on a nearby ship.
In strong-current regions of the global ocean, the IES vertical acoustic echo time measurements have been used to estimate, with remarkable accuracy, entire profiles of temperature T(p) and specific-volume anomaly δ(p) (or equivalently density ρ(p)). From hydrographic data, two-dimensional τ-parameterizations of these fields, TG(τ,p) and δG(τ,p), can be computed. We call each of these a “gravest empirical mode” (GEM) representation of the vertical structure. IES measurements of τ, combined with the GEM interpretation, produce estimated T(p) and δ(p) time series at each site. Time-series profiles of geopotential thickness, φ(p) = ∫0p δ(p’)dp’, can then be estimated above each IES. Pairs of IESs give φ(p) lateral differences, which, through geostropy, determine profiles of average baroclinic shear between the two sites (normal to the sites’ separation vector). An L-shaped group of three IESs determines estimates of both velocity components. A 2-D array of appropriately spaced IESs can map out the 3-D structure of the horizontal velocity field. Additionally, the deep pressure and current measurements provide referencing to make the velocity profiles absolute.
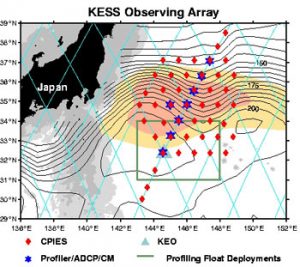 The Kuroshio Extension System Study (KESS) array of inverted echo sounders equipped with bottom pressure gauges and current meters (CPIES, diamonds), moored profilers (MPs, stars) equipped with upward-looking acoustic Doppler current profilers (ADCPs) and deep current meters, and KEO surface buoy (triangle). Argo profiling floats were deployed within the green boxed region to measure the temperature and salinity fields. Thin light blue lines indicate Jason-1 ground tracks. Solid lines are the GDEM mean surface dynamic height contours in dyn cm from Teague et al. (1990). The 2000 and 4000 m isobaths are shaded dark and light gray respectively. Eddy kinetic energy > 0.18 and 0.23 m2s-2 is color shaded yellow and orange respectively. CTD/SADCP observations were made at all CPIES sites.
The moored array was designed to measure the time-varying density and velocity fields with the 4-D mesoscale resolution required to determine dynamical balances and cross-frontal exchanges of heat, salt, momentum, and PV. The high-resolution in situ instrument array was centered on the first quasi-stationary meander trough east of Japan, indicated by the GDEM mean surface dynamic height contours (black in above figure). The array was located in the region of highest eddy kinetic energy (yellow and orange shadings).
The in situ observations spanned a two-year period. The instruments were deployed on a cruise aboard the R/V Thompson in Spring 2004. On a mid-experiment cruise conducted during June-July 2005 aboard the R/V Revelle, the moored profiler moorings were recycled and their data collected. Daily measurements of pressure, travel time and currents were telemetered to the ship from the CPIES and a CTD/ADCP feature survey was conducted. The moored instruments were recovered during May and June 2006 on a cruise aboard the R/V Melville.
Additional information about the KESS cruises, including cruise reports, may be found the cruises tab.