GCM Modeling Results
Overview | Results
1/10° Parallel Ocean Program General Circulation Model
During the first of the KESS cruises, a Conductivity–Temperature–Depth (CTD) section was collected along a ground track of TOPEX/Poseidon that intersected the Kuroshio around 146°E. To compare the model results with direct observations, a weekly average of the simulation in the same season was chosen when the Kuroshio Extension System showed a similar meandering state.
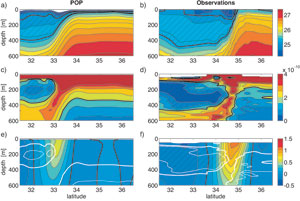 The potential density, potential vorticity, and eastward velocities from the model and those measured in May 2004 across the Kuroshio are shown. The observed fields are obtained by a composite of all the CTD stations collected during KESS along that particular line, the velocity section is derived from a smooth objective map of the shipboard Acoustic Doppler Current Profiler (ADCP) data. The planetary potential vorticity, Q, is defined as
  where f is the inertial frequency, ρ the density, and σθ the potential density. Corresponding fields in the POP model, along the same section but averaged over the last week of May 1999. Note that the particular location of the core of the Kuroshio is not important, since it is stochastically meandering.
The model compares relatively well with the hydrographic observations. The model fields are smoother, primarily due to limited vertical resolution of the model: there are nine vertical levels between the surface and 100 m, five between 100 and 200 m, and six between 200 and 600 m. In both cases, the potential vorticity minimum (Q < 2 × 10⁻¹⁰ m-1 s-1) on the south side of the Kuroshio extends close to the core of the current. The magnitudes of the variables are similar, and the steepness of the Kuroshio front is comparable. The maximum eastward speed in the model is 0.6 ms-1, compared to 1.1 ms-1 in the observations. While the maximum potential vorticity in this section in the model is comparable to that of the observations (36 and 47 × 10-10 m-1 s-1, respectively), the minimum potential vorticity, found in the STMW layer, is not nearly as small in the model 0.7 × 10⁻¹⁰ m-1 s-1 relative to 0.2 × 10⁻¹⁰ m-1 s-1 in the observations. Despite these differences, the representation of the Kuroshio Extension region in the POP model appears to be realistic: distinct water masses are present at the right densities, an unstable meandering jet is well resolved, and the average kinetic energy of the region is of the right order of magnitude.