CPIES Results
Overview | Results
Two States of Variability
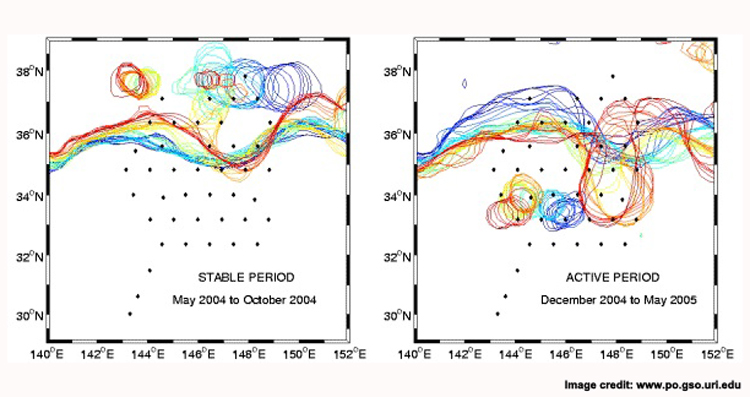
Satellite altimetry shows the Kuroshio Extension alternates between relatively stable and vigorous meandering intervals on decadal time scales (Qiu and Chen, 2005). The Kuroshio extension transitioned between these two states in fall 2004. SSH fields for the stable period (below left) show two nearly stationary meanders and a westward propagating warm core ring in the KESS region. During the active period (below right), a steep trough develops and a cold core ring forms.
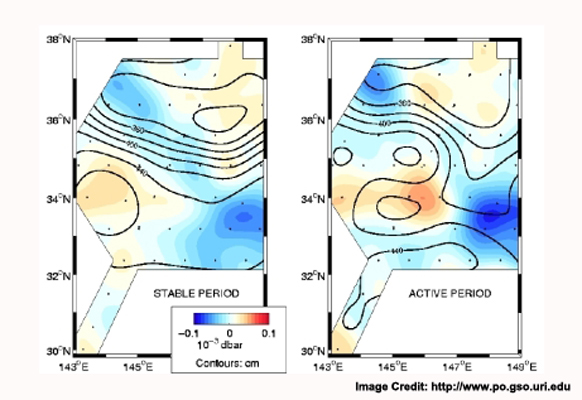
Upper (contours in cm) and Deep (color in dbar) Mean Streamfunctions
During the stable period (below left), the upper mean streamfunction shows a well-defined KE front and recirculation gyre SW of a mean weak meander trough. Anticyclonic circulation in the deep streamfunction is the deep expression of the southern recirculation gyre. There is weak cross-frontal flow under the trough. During the active period (below right), there is increased meandering which produces weaker lateral gradients across the KE mean front. Both the trough and cold core ring are evident in the mean. Deep features are intensified during the active period.
Mesoscale features alias satellite SSH
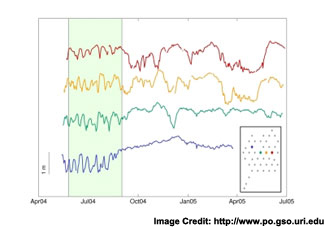
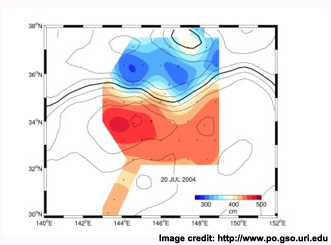
From May to September 2004 (below left, the green hatched area in SSH (m) time series) a series of rapid, eastward propagating (25-30 km/d) meanders were observed by the CPIES. These short wavelength (160 km) meanders were not resolved by satellite SSH (below right, SSH colors and contours in cm).
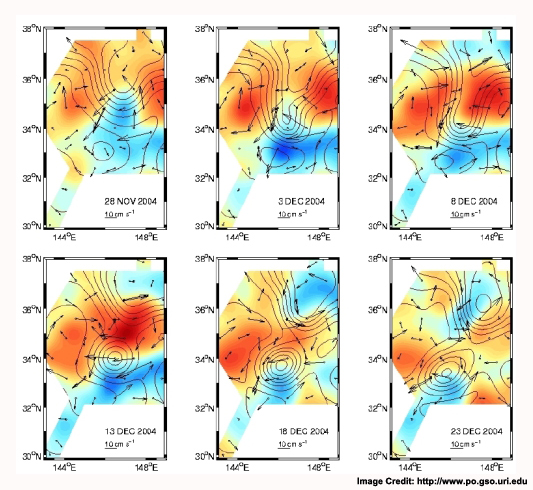
Jet interaction with deep eddies
A meander trough steepens during December 2004 and pinches off a cold core ring. Deep cyclones and anticyclones move from the northeast to southwest. Upper and deep layers interact and jointly intensify. Deep eddies play an important role in the pinch-off process. Velocity is shown by arrows in cm s-1. SSH is shown by contours (in cm) and color (in dbar), red is high and blue is low. Peak values are -0.25 and 0.25 dbar.
Movies
Plan-view maps in movies show several observations:
- Deep pressure field anomaly in color
- Upper stream function by the gray and black contours
- Bottom velocities vectors: measured (black) and mapped (gray)
- Argo float tracks with unique colors and symbols used for each float
| Movie 1: | Movie 2: | Movie 3: |
 |
 |
 |
| Daily Maps for the two-year period 1 June 2004 to 1 May 2006 (82 Mb) | Daily Maps with superimposed Argo Float tracks for the two year period 1 June 2004 to 1 May 2006 (80 Mb) |
Daily Maps for the period of Ring 04B formation, 15 November 2004 to 31 January 2005 (13 Kb) |
